yoshinoGraph 7.0.2
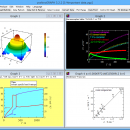
yoshinoGRAPH, developed by Harukazu Yoshino, is a versatile graphing software designed for scientists and engineers. It excels in plotting 2D and 3D data with precision, offering a range of customization options for detailed analysis. The intuitive interface supports various data formats and includes advanced features like curve fitting and data smoothing. Ideal for academic and professional use, yoshinoGRAPH is a powerful tool for visualizing complex datasets effectively. ...
| Author | Harukazu YOSHINO |
| License | Freeware |
| Price | FREE |
| Released | 2024-07-20 |
| Downloads | 633 |
| Filesize | 2.20 MB |
| Requirements | |
| Installation | Instal And Uninstall |
| Keywords | chart, analysis, research tool, graph, scientific software, data analysis, analyze chart, formula |
| Users' rating (21 rating) |
Using yoshinoGraph Free Download crack, warez, password, serial numbers, torrent, keygen, registration codes,
key generators is illegal and your business could subject you to lawsuits and leave your operating systems without patches.
We do not host any torrent files or links of yoshinoGraph on rapidshare.com, depositfiles.com, megaupload.com etc.
All yoshinoGraph download links are direct yoshinoGraph full download from publisher site or their selected mirrors.
Avoid: 3d scatter oem software, old version, warez, serial, torrent, yoshinoGraph keygen, crack.
Consider: yoshinoGraph full version, 3d scatter full download, premium download, licensed copy.