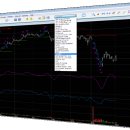
GRAFster 7.3.5.4

GRAFster6 is an easy to use charting and analysis application. Use it to plot equities, indices, futures, ... format. It offers most of the usual technical analysis indicators without being redundant, a few uncommon ones, and some for which you will jave to pay plenty. ...

Author theGRAFster
License Trialware
Price $20.00
Released 2022-10-07
Downloads 446
Filesize 3.60 MB
Requirements
Installation Instal And Uninstall
Keywords create graph, technical analysis, chart application, graph, analyze, technical
Users' rating
(12 rating)
GRAFsterOffice Suites & ToolsWindows XP, Windows Vista, Windows Vista x64, Windows 7, Windows 7 x64, Windows 8, Windows 8 x64, Windows 10, Windows 10 x64, Windows 11
GRAFster analysis chart - Download Notice

Using GRAFster Free Download crack, warez, password, serial numbers, torrent, keygen, registration codes, key generators is illegal and your business could subject you to lawsuits and leave your operating systems without patches. We do not host any torrent files or links of GRAFster on rapidshare.com, depositfiles.com, megaupload.com etc. All GRAFster download links are direct GRAFster full download from publisher site or their selected mirrors.
Avoid: analysis chart oem software, old version, warez, serial, torrent, GRAFster keygen, crack.
Consider: GRAFster full version, analysis chart full download, premium download, licensed copy.

GRAFster analysis chart - The Latest User Reviews

Most popular Office Suites & Tools downloads

Flying Logic Professional

4.0.16 download

... professionals across various industries, including project management, business analysis, and academic research. At its core, Flying ... a project workflow, or conducting a root cause analysis, Flying Logic Professional provides the tools you need ...

Power-user

1.7.48.0 download

... reduce the time spent on data manipulation and analysis. Features such as the Waterfall chart, Gantt chart, and Mekko chart enable users to present data in a more ...

New Version

SSuite OmegaOffice FHD+

2.40.6.4 download

... and visualize data through reports or vibrant 2D/3D charts. Easily import external data via ODBC, sort information, and perform advanced statistical analysis. Try it Online: homepage The built-in Chart Wizard lets you choose from over eight chart ...

New Version

5dchart Add-In for MS Excel

3.2.0.1 download

Create stunning 3D bubble charts in Excel with 5dchart Add-In! 5dchart Add-In for ... It allows you to display a 3D bubble chart with two additional parameters: 3D coordinates of each ... easily! 5dchart Add-In is designed to allow 3D charts drawing directly in Microsoft Excel without using any ...

QI Macros SPC Software for Mac

2018-04 download

... easy-to-use Excel add-in for all of your data analysis needs. It draws pareto charts, histograms with Cp Cpk, box whisker plots, scatter and control charts. It contains over 100 Lean Six Sigma fill-in-the-blank ...

Microsoft Excel

2016 16.0.6741.2048 download

... own, and perform calculations with modern formulas. New charts and graphs help you present your data in ... results you are looking for. Do your analysis: Excel will perform complex analyses for you. And ...

GRAFster

7.3.5.4 download

GRAFster6 is an easy to use charting and analysis application. Use it to plot equities, indices, futures, ... format. It offers most of the usual technical analysis indicators without being redundant, a few uncommon ones, ...

QI Macros SPC Software for Excel

2018-04 download

... easy-to-use Excel add-in for all of your data analysis needs. It draws Pareto charts, histograms with Cp Cpk, box whisker plots, scatter and control charts. It contains over 100 Lean Six Sigma fill-in-the-blank ...

Microsoft Project

2016 16.0.6741.2048 download

The Microsoft Project is made specifically for the analysis and management of projects. You can use the ... meeting deadlines. Microsoft Project can create Gantt charts and diagrams of various types, also enclosing rich ...

WPS Office Premium

12.2.0.21563 download

... WPS Spreadsheets provides a powerful platform for data analysis and visualization. It supports complex formulas, pivot tables, and a variety of chart types, making it suitable for everything from simple data entry to in-depth financial analysis. The data encryption feature adds an extra layer ...

New Version