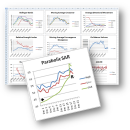
TraderCode Technical Indicators 5.0
TraderCode is a library of technical analysis functions for used with Microsoft Excel. It allows you to create many types of technical indicators used in trading systems like Moving Averages, Directional Movements, Oscillators,Pivot Points, Donchian Channels and many more. With these indicators you can easily perform end-of-day analysis or back-testing of historical stock data. The software comes with both formulas for Excel and an add-in Wizard. ...
| Author | ConnectCode Pte Ltd |
| License | Demo |
| Price | $165.00 |
| Released | 2010-11-10 |
| Downloads | 951 |
| Filesize | 5.41 MB |
| Requirements | Excel 2003, Excel 2007, Excel 2010 |
| Installation | Install and Uninstall |
| Keywords | technical indicator, technical indicators, techical analysis, techical analysis indicators, stock trading |
| Users' rating (8 rating) |
Using TraderCode Technical Indicators Free Download crack, warez, password, serial numbers, torrent, keygen, registration codes,
key generators is illegal and your business could subject you to lawsuits and leave your operating systems without patches.
We do not host any torrent files or links of TraderCode Technical Indicators on rapidshare.com, depositfiles.com, megaupload.com etc.
All TraderCode Technical Indicators download links are direct TraderCode Technical Indicators full download from publisher site or their selected mirrors.
Avoid: chart toolbox oem software, old version, warez, serial, torrent, TraderCode Technical Indicators keygen, crack.
Consider: TraderCode Technical Indicators full version, chart toolbox full download, premium download, licensed copy.


