Free Dashboard Add in 20180614

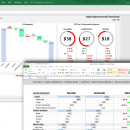
FREE! 6 AMAZING DASHBOARD ADD-IN TOOLS OTHERS WILL CHARGE YOU OVER $100 FOR THESE All these tools work in seconds anything created with the add-in can be shared with anyone users of your spreadsheets DO NOT need a copy of the add-in WATERFALL PROGRESS RING GAUGE (SPEEDOMETER, TACHOMETER) LOLLIPOP VARIANCE GANTT Works with any version of Windows with installed Excel 2010 or later. [Mac, mobile and online versions not supported] ...

Author Airt Ltd
License Freeware
Price FREE
Released 2018-06-14
Downloads 105
Filesize 1.39 MB
Requirements Excel 2010 or Later (Windows Version Only)
Installation Install and Uninstall
Keywords excel, add-in, dashboard, charts, tools, waterfall, progress, ring, gauge, gantt, lollipop, variance
Users' rating
(3 rating)
Free Dashboard Add inOffice Suites & ToolsWin2000, Windows XP, Windows 7 x32, Windows 7 x64, Windows 8, Windows 10, WinServer, WinOther, Windows Vista, Windows Vista x64
Free Dashboard Add in charts - Download Notice

Using Free Dashboard Add in Free Download crack, warez, password, serial numbers, torrent, keygen, registration codes, key generators is illegal and your business could subject you to lawsuits and leave your operating systems without patches. We do not host any torrent files or links of Free Dashboard Add in on rapidshare.com, depositfiles.com, megaupload.com etc. All Free Dashboard Add in download links are direct Free Dashboard Add in full download from publisher site or their selected mirrors.
Avoid: charts oem software, old version, warez, serial, torrent, Free Dashboard Add in keygen, crack.
Consider: Free Dashboard Add in full version, charts full download, premium download, licensed copy.

Free Dashboard Add in charts - The Latest User Reviews

Most popular Office Suites & Tools downloads

LibreOffice

24.8.2.1 download

... then use it to present your final output. Charts and analysis tools help bring transparency to your conclusions. A fully-integrated help system makes easier work of entering complex formulas. Add ...

New Version

LibreOffice for Linux

24.2.4 download

... then use it to present your final output. Charts and analysis tools help bring transparency to your conclusions. A fully-integrated help system makes easier work of entering complex formulas. Add ...

RecMind

1.2.0 download

... tool for drawing beautiful, professional mind maps, organization charts, family trees, sitemaps. It supports brain storming and presentation perfectly. 1)Presentation:With RecMind, you can show up demostration of your work with ...

Abex Excel to Flash Converter

4.5 download

... the original Excel layouts, text content, table, pictures, charts etc in the generated SWF files. The interface of Abex Excel to Flash Converter has been designed to be user-friendly and ...

Microsoft Power BI Desktop

2.136.1202.0 download

... offers a rich library of visualizations, including bar charts, line graphs, scatter plots, maps, and more. These visualizations are highly interactive, enabling users to drill down into data, filter results, ...

New Version

LibreOffice x64

24.2.4 download

... then use it to present your final output. Charts and analysis tools help bring transparency to your conclusions. A fully-integrated help system makes easier work of entering complex formulas. Add ...

LibreOffice for Mac

24.2.4 download

... then use it to present your final output. Charts and analysis tools help bring transparency to your conclusions. A fully-integrated help system makes easier work of entering complex formulas. Add ...

PlusX Excel Add-In

1.2 download

... menu. The application has several groups of functionality: Charts , Shortcuts , Rates and Browser. It enables the user to create 5 addititonal Charts : Waterfall ( Bridge ) , Gantt ( ...

Microsoft Excel

2016 16.0.6741.2048 download

... own, and perform calculations with modern formulas. New charts and graphs help you present your data in ... that tells your story best. Flow into charts and graphs: Excel can recommend the charts and ...

i-net Clear Reports

24.4.315 download

... of designing reports, enabling users to effortlessly incorporate charts, graphs, and other visual elements. This ensures that even complex data sets can be presented in a clear and understandable manner. ...