GlowCode 10.0 Build 1002.1

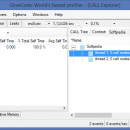
GlowCode detects memory and resource leaks, finds performance bottlenecks, traces program execution, and finds unexecuted code. GlowCode is a complete performance toolset for Windows programmers, and diagnoses all x64 and Win32 EXEs and DLLs developed with .NET languages including Visual Studio 2010 and prior versions. Using GlowCode does not involve any source code or build changes, or tedious, post-build pass. ...

Author Electric Software
License Trialware
Price $499.00
Released 2017-06-28
Downloads 571
Filesize 2.26 MB
Requirements
Installation Instal And Uninstall
Keywords Memory Leak Detection, Code Profiling, Function Call Tracing, memory, leak, detection
Users' rating
(22 rating)
GlowCodeDebuggingWindows XP, Windows Vista, Windows 7, Windows 8, Windows 10
GlowCode debug - Download Notice

Using GlowCode Free Download crack, warez, password, serial numbers, torrent, keygen, registration codes, key generators is illegal and your business could subject you to lawsuits and leave your operating systems without patches. We do not host any torrent files or links of GlowCode on rapidshare.com, depositfiles.com, megaupload.com etc. All GlowCode download links are direct GlowCode full download from publisher site or their selected mirrors.
Avoid: debug oem software, old version, warez, serial, torrent, GlowCode keygen, crack.
Consider: GlowCode full version, debug full download, premium download, licensed copy.

GlowCode debug - The Latest User Reviews

Most popular Debugging downloads

ByteScout Bitmap Visualizer

1.0.5.105 download

Bytescout Bitmap Visualizer (freeware) Debugger bitmap objects content visualization add-on for Visual Studio ... a Bitmap object in a source code (in Debugger) and clicking the tiny magnifier button in the

CAS Modbus RTU Parser

1.00gD download

Have you ever needed to analyze a Modbus RTU message? The CAS Modbus RTU parser can analysis a Modbus RTU message and tell you if there are any errors in the ...

GlowCode

10.0 Build 1002.1 download

... any build of your product, even while your debugger is active. Real-Time. See profile results data ... C#, VisualBasic and other compilers that generate .PDB debug information. If .PDB debug information is not available, ...

mprocs

0.7.2 download

"Mprocs" is an innovative command-line tool developed by Pavel Volokitin, designed to enhance productivity for developers and system administrators by facilitating the simultaneous execution of multiple commands. This software stands out ...

HTTP Debugger Pro

1.2 download

HTTP Debugger is a full-scale tool for developers for viewing ... a decoded (how browsers see it) format. HTTP Debugger works with all today's alternative browsers and their ... your own software. You can even monitor and debug ICQ, MSN, Yahoo Messenger and other popular Internet ...

Rancher Desktop

1.17.0 download

Rancher Desktop, developed by Rancher Sandbox, is a versatile open-source application designed to streamline the container management experience for developers. This powerful tool integrates seamlessly with Kubernetes, providing an intuitive interface ...

ILSpy

8.1.1.7464 download

... essential tool for developers who need to understand, debug, or analyze third-party libraries, legacy code, or even ... capabilities, ILSpy includes features such as assembly editing, debugging support, and integration with Visual Studio, further enhancing ...

Look RS232

4.3 download

Look RS232 is a tool for debugging computer connection with peripheral devices using COM port, such as modem, mini-ATS, projector etc. Its easy to use interface guarantees an easy work ...

Shell Reset

1.2.0.161 download

Debugging of Shell extensions is a simple process. Its ... don't have access to some Explorer features while debugging your Shell Extension Shell Reset Tool was developed ... depending on what he used to develop and debug shell extensions (Borland Delphi, Microsoft Visual Studio or ...

DLL Export Viewer

1.66 download

... of the desired function, paste it into your debugger, and set a breakpoint for this memory address. When this function is called, the debugger will stop in the beginning of this function. ...