IBTrader 1.7
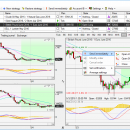
Trading commodities and spreads through the Interactive Brokers. Charts quoted in money enable analysis of an entire spread at a glance. Sending orders to the exchange by a few simple clicks. Merging orders into logical groups. The program automatically sends orders to the exchange, or only alerts you to the situation. You can create a set of rules that are executed after completion of the previous rules. Rules can be based on average price. ...
| Author | MKNet s.r.o. |
| License | Free To Try |
| Price | $150.00 |
| Released | 2016-05-03 |
| Downloads | 181 |
| Filesize | 897 kB |
| Requirements | .Net Framework 4 |
| Installation | Install and Uninstall |
| Keywords | IBTrader, trading, futures, commodities, spread, exchange, trading software, Interactive Brokers, MRCI, TWS |
| Users' rating (8 rating) |
Using IBTrader Free Download crack, warez, password, serial numbers, torrent, keygen, registration codes,
key generators is illegal and your business could subject you to lawsuits and leave your operating systems without patches.
We do not host any torrent files or links of IBTrader on rapidshare.com, depositfiles.com, megaupload.com etc.
All IBTrader download links are direct IBTrader full download from publisher site or their selected mirrors.
Avoid: graph oem software, old version, warez, serial, torrent, IBTrader keygen, crack.
Consider: IBTrader full version, graph full download, premium download, licensed copy.


