MindFusion.Charting for ASP.NET 3.4

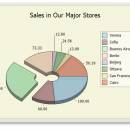
... includes Graph, Line, Area, Bar, Polar, Radar and Pie Chart components. Each of them can be fully customized via the hundreds properties and methods exposed. All controls support data-binding for fast database reports. Data for visualization can be also provided programmatically. MindFusion.Charting is royalty free for client and server side use. 12 month upgrade subscription. ...

Author MindFusion LLC
License Commercial
Price $300.00
Released 2011-07-19
Downloads 256
Filesize 5.00 MB
Requirements ASP.NET 3.5 or higher version
Installation Install and Uninstall
Keywords pie, line, area, bar, chart, charting, graph, graphics, business, visualization, ASP.NET, DotNET, control, component, Web Forms
Users' rating
(5 rating)
MindFusion.Charting for ASP.NETComponents & LibrariesWin2000, Windows 7 x32, Windows 7 x64, WinServer, Windows Vista, Windows Vista x64, Windows XP
MindFusion.Charting for ASP.NET pie - Download Notice

Using MindFusion.Charting for ASP.NET Free Download crack, warez, password, serial numbers, torrent, keygen, registration codes, key generators is illegal and your business could subject you to lawsuits and leave your operating systems without patches. We do not host any torrent files or links of MindFusion.Charting for ASP.NET on rapidshare.com, depositfiles.com, megaupload.com etc. All MindFusion.Charting for ASP.NET download links are direct MindFusion.Charting for ASP.NET full download from publisher site or their selected mirrors.
Avoid: pie oem software, old version, warez, serial, torrent, MindFusion.Charting for ASP.NET keygen, crack.
Consider: MindFusion.Charting for ASP.NET full version, pie full download, premium download, licensed copy.

MindFusion.Charting for ASP.NET pie - The Latest User Reviews

Most popular Components & Libraries downloads

MindFusion.Charting for WinForms

4.0.1 download

... includes Graph, Line, Area, Bar, Candlestick, Radar and Pie charts and Oval and Linear gauges. Each of ... the axis; · Four different axes labels types; Pie charts: · Several pies in one chart; · ...

DISLIN for Salford FTN90

10.6 download

DISLIN is a high-level library of subroutines and functions that display data graphically. It is intended to be a powerful and easy to use software package for programmers and scientists that ...

DISLIN for pgf77/pgf90 (wrapper)

10.6 download

DISLIN is a high-level library of subroutines and functions that display data graphically. It is intended to be a powerful and easy to use software package for programmers and scientists that ...

Free Spire.XLS for .NET

7.3.5 download

... Excel formulas. Provides a wide range of Charts: Pie Chart, Bar Chart, Column Chart, Free Spire.XLS for .NET component supports data transportation between database and Excel in C# VB.NET or ...

DISLIN PDF Manual

9.5 download

DISLIN is a high-level library of subroutines and functions that display data graphically. It is intended to be a powerful and easy to use software package for programmers and scientists that ...

DISLIN for MS Visual C++

10.6 download

DISLIN is a high-level library of subroutines and functions that display data graphically. It is intended to be a powerful and easy to use software package for programmers and scientists that ...

DISLIN for Python

10.6 download

DISLIN is a high-level library of subroutines and functions that display data graphically. It is intended to be a powerful and easy to use software package for programmers and scientists that ...

FusionCharts for Flex

2.1 download

... * Standard charts like Column, Bar, Line, Pie, Doughnut, Area etc. * Multi-series charts, Stacked charts and Combination charts with support for dual axis * Funnel and Pyramid charts ...

WinRT XAML Controls

2022.1 Build 0365 download

... variety of chart types, including line, bar, and pie charts, to present data in a compelling and interactive manner. The charts are highly customizable, allowing for detailed configuration to meet ...

TeeChart for .NET

2024 download

... types: from the commonly used Bar, Line, Area, Pie, Gantt, Bubble, to those more a 'field-specific charts' such as Candles, Kagi, Renko, Darvas and Contour - 50+ financial and statistical ...