Nonlinear analysis - DataFitting 1.7.73

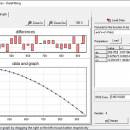
DataFitting is a powerful statistical analysis program that performs linear and nonlinear regression analysis (i.e. curve fitting). DataFitting determines the values of parameters for an equation, whose form you specify, that cause the equation to best fit a set of data values. ...

Author Institute of Mathematics and Statistics
License Free To Try
Price $15.00
Released 2025-06-05
Downloads 67
Filesize 2.92 MB
Requirements None
Installation Install and Uninstall
Keywords datafitting, data, fitting, least squares, curve fitting, nonlinear, non-linear, regression, equation, curve fit, formula, parsing, function
Users' rating
(8 rating)
Nonlinear analysis - DataFittingMathematicsWin2000, Windows 7 x32, Windows 7 x64, WinOther, Windows Vista, Windows Vista x64, Windows XP, Other
Nonlinear analysis - DataFitting plots - Download Notice

Using Nonlinear analysis - DataFitting Free Download crack, warez, password, serial numbers, torrent, keygen, registration codes, key generators is illegal and your business could subject you to lawsuits and leave your operating systems without patches. We do not host any torrent files or links of Nonlinear analysis - DataFitting on rapidshare.com, depositfiles.com, megaupload.com etc. All Nonlinear analysis - DataFitting download links are direct Nonlinear analysis - DataFitting full download from publisher site or their selected mirrors.
Avoid: plots oem software, old version, warez, serial, torrent, Nonlinear analysis - DataFitting keygen, crack.
Consider: Nonlinear analysis - DataFitting full version, plots full download, premium download, licensed copy.

Nonlinear analysis - DataFitting plots - The Latest User Reviews

Most popular Mathematics downloads

Equation graph plotter - EqPlot

1.3.67 download

EqPlot plots 2D graphs from complex equations. The application comprises algebraic, trigonometric, hyperbolic and transcendental functions. EqPlot can be used to verify the results of nonlinear regression analysis program. Graphically ...

ODEcalc

6.711 download

... initial value conditions and it solves your problem. Plots solution y and derivative ydot versus x. Solves most Boundary Value Problems (BVP) and Initial Value Problems (IVP) for Nth order ...

Nonlinear regression - CurveFitter

4.5.72 download

... data have been fit, CurveFitter automatically sorts and plots the fitted equations by the statistical criteria of Standard Error. A residual graph as well as parameter output is generated for ...

Nonlinear analysis - DataFitting

1.7.73 download

... data have been fit, DataFitting automatically sorts and plots the fitted equations by the statistical criteria of Standard Error. You can preview your graph and output publication-quality graphs in several ...

wxMaxima for Windows

19.09.1 download

... dialogs for many common maxima commands, autocompletion, inline plots and simple animations. wxMaxima is distributed under the GPL license. Features: · 2D formatted math display: wxMaxima implements ...

wxMaxima for Mac OS X

19.01.2 download

... dialogs for many common maxima commands, autocompletion, inline plots and simple animations. wxMaxima is distributed under the GPL license. Features: · 2D formatted math display: wxMaxima implements ...

PTC Mathcad Express

3.1 download

... and functional models with polar, contour and surface plots. - Structure you engineering design workflow and establish best practices by leveraging worksheet templates. When the 30 day trial period has ...

Rt-Plot

2.8.10.83 download

... integration, during entering. Rt-Plot enables you to create plots fast and easily. The line calculations give full access to calculation and display ranges and can use statistical weights. The options ...

5 award

Graph

4.4.2 download

This program is for drawing graphs of mathematical functions in a coordinate system. Graphs may be added with different color and line styles. Both standard functions, parameter functions and polar functions ...

Statmaster

2.30 download

... up to 8 pages of histograms and XY plots, up to 64 graphs per page. The way in which the data is presented is defined in a simple Windows inifile, ...