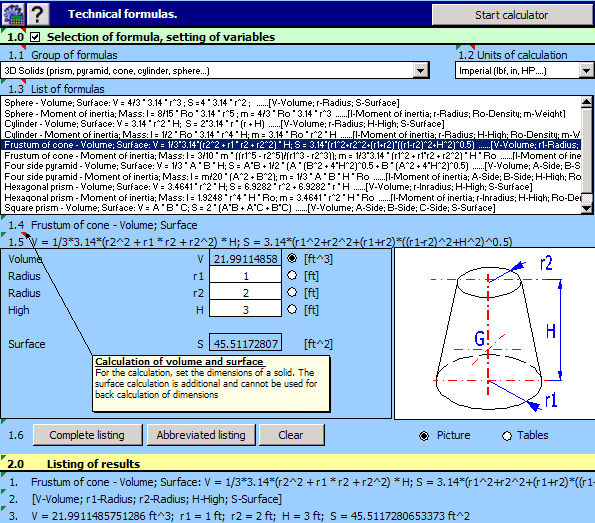
Excel VBA Models Set 2 XL-VBA2.0

Provides 12 random numbers generators - Log Normal, Log Pearson Type III, Normal, Chi-Square, F-Distribution, Student-T Distribution, Multivariate Standard Normal Distribution,Gamma, Beta, Hypergeometric, Triangular, and Binomial distributions ...

Author Excel Business Solutions Int'l Corp.
License Free To Try
Price $29.95
Released 2005-02-01
Downloads 869
Filesize 325 kB
Requirements PC
Installation Install and Uninstall
Keywords Excel VBA, Open Source Code, Statistics, Random Number, Log Normal, Log Pearson Type III, Normal, Chi-Square, F-Distribution, Gamma, Beta, Hypergeometric, Triangular, Binomial
Users' rating
(2 rating)
Excel VBA Models Set 2Math & Scientific ToolsWindows 2000, Windows XP, Windows 2003, Windows Vista, Windows Vista x64, Windows Vista
Excel VBA Models Set 2 spreadsheet - Download Notice

Using Excel VBA Models Set 2 Free Download crack, warez, password, serial numbers, torrent, keygen, registration codes, key generators is illegal and your business could subject you to lawsuits and leave your operating systems without patches. We do not host any torrent files or links of Excel VBA Models Set 2 on rapidshare.com, depositfiles.com, megaupload.com etc. All Excel VBA Models Set 2 download links are direct Excel VBA Models Set 2 full download from publisher site or their selected mirrors.
Avoid: spreadsheet oem software, old version, warez, serial, torrent, Excel VBA Models Set 2 keygen, crack.
Consider: Excel VBA Models Set 2 full version, spreadsheet full download, premium download, licensed copy.

Excel VBA Models Set 2 spreadsheet - The Latest User Reviews

Most popular Math & Scientific Tools downloads

TriLookupLite Mac

3.0 download

Excel add-in with eleven powerful worksheet functions for 1, 2 and 3 variable lookup and interpolation. Interpolation modes include: closest-value, linear, piecewise parabolic or hyperbolic, cubic spline and polynomial up to ...

XLRISK

6.1.3.3 download

... more. - Reporting: View simulation results statistics in spreadsheet, Export results to PowerPoint, Word, PDF or Excel, ... help file and example models, functions descriptions in spreadsheet. - Technical tools: Data Viewer, assumption and result ...

Excel VBA Models Set 2

XL-VBA2.0 download

... output random numbers from the distribution on the spreadsheet. It contains practical and well explained examples of: Do you want to see how random numbers from different probability distribution are ...

StatPlus

6.2.2.0 download

... processor (from sampling up to special transformations). Its spreadsheet features: reads Microsoft Excel,StatSoft Statistica,SPSS formats, plots charts - histograms, bars, areas, point-graphs, pies, etc; Students and academic discounts make this ...

TriLookup

3.0 download

Excel add-in with eleven powerful worksheet functions for 1, 2 and 3 variable lookup and interpolation. Interpolation modes include: closest-value, linear, piecewise parabolic or hyperbolic, cubic spline and polynomial up to ...

CompactSections

2.0.4 download

... be driven with VBA to greatly extend Excel spreadsheet analysis. It may also be used with any tool which can communicate through COM, this includes MATLAB, MATHCAD, Active Perl, ActivePython. ...

StatCalc Win

9.1.6 download

This very user-friendly analytical tool simplifies common statistical calculations with 31 procedures. Use StatCalc to easily create and compare summary statistics, develop confidence intervals, and verify hand calculations. Enter data to ...

BioStat 2009

5.8.3.0 download

BioStat - user-friendly biology and medicine oriented statistical software. With BioStat 2009, one gets a robust suite of statistics tools and graphical analysis methods that are easily accessed though a simple ...

StatPlus 2009 Portable

5.8.3.0 download

... about the learning curve thanks to its intuitive, spreadsheet-like user interface that is as easy to use as MS Excel. Are you working in a lab or studying for your ...

Grab It

XP download

Grab It! is a Microsoft Excel based application that digitizes data from pictures. Graphs and charts can have data point values digitized or have angle and distance measurements made on scanned ...