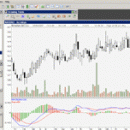
ChartNexus for Stock Markets 3.1.1
Behind every successful trader or investor is a stock market charting software. We are lowering your operating cost as a trader and investor by offering you ChartNexus Charting (Stock Market Analysis) Software for FREE! Comes with list of indicators, and 3-years EOD market data (updated daily). e.g AMEX, NASDAQ, NYSE, BSE, NSE, HKSE, HOSE, JSX, KLSE, SGX, SET, SSE, SZSE, TWSE, TWOTC, World Indices, etc ...
| Author | ChartNexus |
| License | Freeware |
| Price | FREE |
| Released | 2010-06-03 |
| Downloads | 1520 |
| Filesize | 2.78 MB |
| Requirements | Java Runtime Environment (JRE)/ Java Development Kit (JDK) 1.5 or higher, 512MB RAM, 500MB HD space |
| Installation | Install and Uninstall |
| Keywords | Stock Market, Stock Analysis, Screener, Backtest, Charting, Java, Mac OS, Linux, Windows, Financial, Nasdaq, AMEX, NYSE, KLSE, World Indices |
| Users' rating (23 rating) |
Using ChartNexus for Stock Markets Free Download crack, warez, password, serial numbers, torrent, keygen, registration codes,
key generators is illegal and your business could subject you to lawsuits and leave your operating systems without patches.
We do not host any torrent files or links of ChartNexus for Stock Markets on rapidshare.com, depositfiles.com, megaupload.com etc.
All ChartNexus for Stock Markets download links are direct ChartNexus for Stock Markets full download from publisher site or their selected mirrors.
Avoid: window zoom oem software, old version, warez, serial, torrent, ChartNexus for Stock Markets keygen, crack.
Consider: ChartNexus for Stock Markets full version, window zoom full download, premium download, licensed copy.


