DigitizeIt for Linux 2.5.9

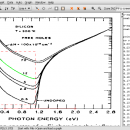
DigitizeIt is an application that digitizes scanned graphs and charts. Graphs can be loaded in nearly all common image formats (incl. gif, tiff, jpeg, bmp, png, psd, pcx, xbm, xpm, tga, pct) or pasted from the clipboard . Digitizing of line and scatter plots occurs automatically, manual digitizing via mouse clicks is also possible. ...

Author Bormisoft
License Trialware
Price $49.00
Released 2021-04-09
Downloads 304
Filesize 1.03 MB
Requirements
Installation Instal And Uninstall
Keywords digitize graph, graph digitizer, digitize chart, digitize, digitizer, chart
Users' rating
(2 rating)
DigitizeIt for LinuxOtherLinux
DigitizeIt for Linux scientific data - Download Notice

Using DigitizeIt for Linux Free Download crack, warez, password, serial numbers, torrent, keygen, registration codes, key generators is illegal and your business could subject you to lawsuits and leave your operating systems without patches. We do not host any torrent files or links of DigitizeIt for Linux on rapidshare.com, depositfiles.com, megaupload.com etc. All DigitizeIt for Linux download links are direct DigitizeIt for Linux full download from publisher site or their selected mirrors.
Avoid: scientific data oem software, old version, warez, serial, torrent, DigitizeIt for Linux keygen, crack.
Consider: DigitizeIt for Linux full version, scientific data full download, premium download, licensed copy.

DigitizeIt for Linux scientific data - The Latest User Reviews

Most popular Other downloads

QtiPlot for Linux

1.2.1 download

QtiPlot is a cross platform data analysis and scientific visualisation solution. Thanks to its price defying all ... used for teaching as well as for complex data analysis and visualisation in companies, high schools, universities ...

ThreeDify Excel Grapher

24.1.213 download

... professionals who require precision and versatility in their data visualization tasks. This powerful tool stands out for its ability to transform complex datasets into clear, compelling graphs and charts, offering users ...

DigitizeIt for Linux

2.5.9 download

... digitizing via mouse clicks is also possible. Data values are transformed to a specified axes system ... be linear, logarithmic or reciprocal scale. Multiple different data sets can be defined and edited. Can handle ...

DigitizeIt for Mac OS X

2.5.9 download

... digitizing via mouse clicks is also possible. Data values are transformed to a specified axes system ... be linear, logarithmic or reciprocal scale. Multiple different data sets can be defined and edited. Can handle ...

Canvas 11

11.0.173c download

... when a project requires various documents, images, and data – even legacy files from obscure formats or obsolete products. Canvas 11 is your cost-effective integrated solution that lets you work ...

Asymptote

2.91 download

... powerful tool stands out in the realm of scientific and mathematical visualization, offering a level of precision ... LaTeX, a widely-used typesetting system for technical and scientific documentation. This integration ensures that the fonts and ...

Veusz for Linux

3.6.2 download

Veusz is a GUI scientific plotting and graphing package. It is designed to ... or Mac OS X, and binaries are provided. Data can be read from text, CSV or FITS files, and data can be manipulated or examined from within the ...

OpenCVTool

3.0.0 Alpha download

... analyze images and contours, while remaining oriented toward scientific and technical uses. Import/export raster formats ... by the industry and research community · Simple data exchange and persistence - all file formats are ...

QtiPlot

1.2.3 download

QtiPlot, developed by Ion Vasilief, is a sophisticated data analysis and scientific plotting software designed to cater to the needs ... it an indispensable asset for anyone involved in data-intensive research and analysis. One of the key ...

QtiPlot for Mac OS X

1.2.1 download

QtiPlot is a cross platform data analysis and scientific visualisation solution. Thanks to its price defying all ... used for teaching as well as for complex data analysis and visualisation in companies, high schools, universities ...